Signal Weather
A complex system enhancing GPS spectrum awareness


01 / Overview
The Challenge: Ensuring Situation Awareness Amid GPS Interferences
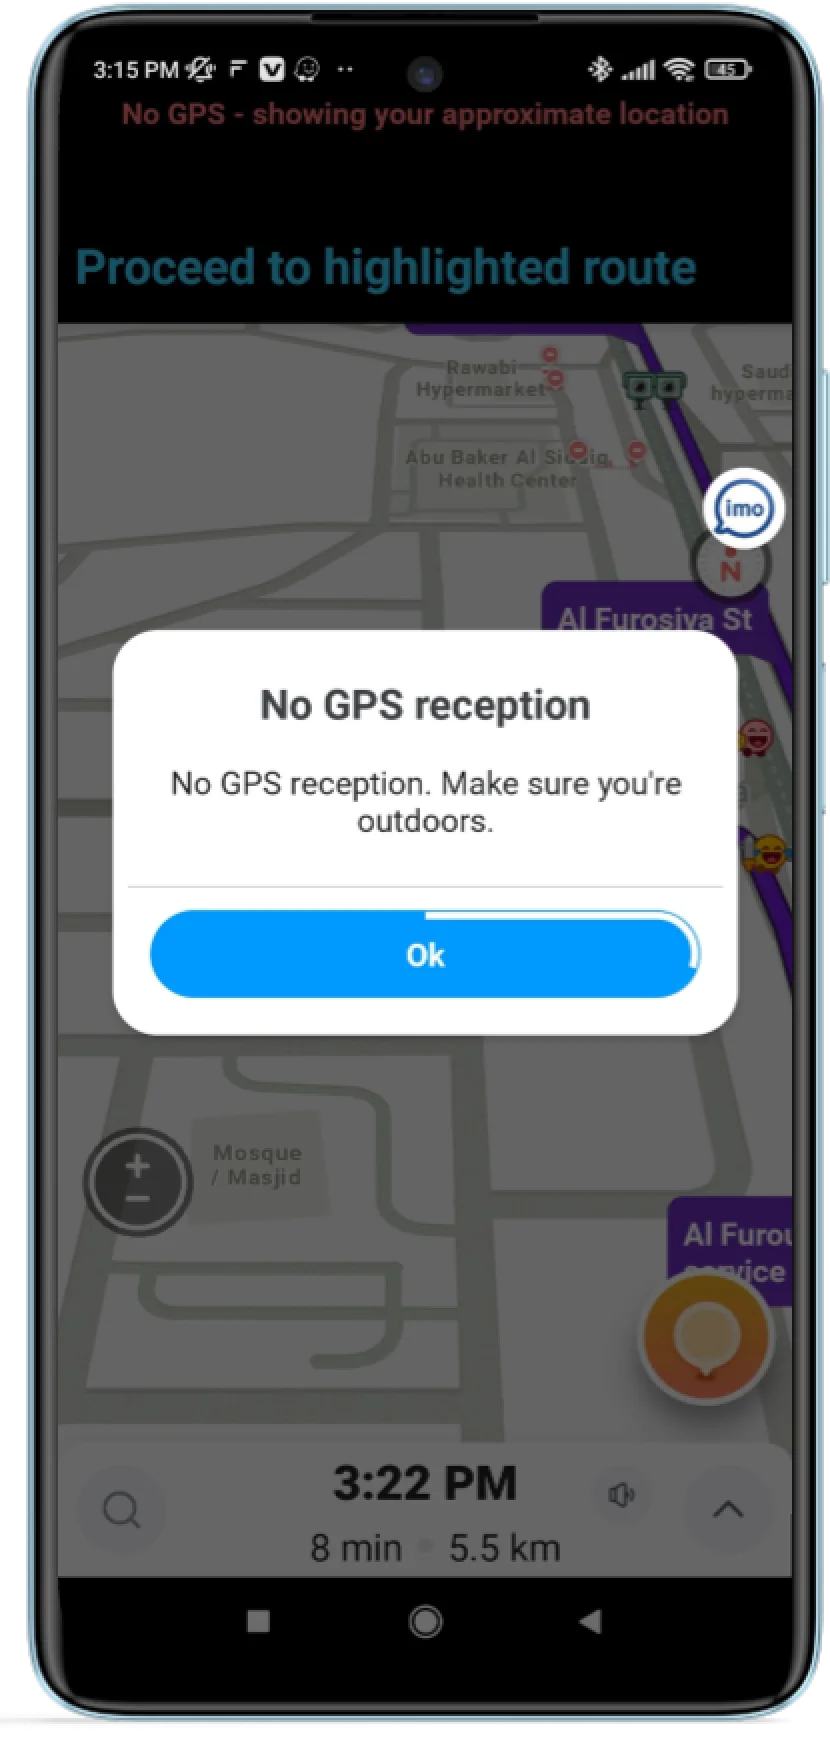
GPS interferences have become a growing concern, affecting daily activities like navigation, public transportation, and food delivery. While a nuisance in everyday life, these interferences are critical in operations where human lives are at stake.


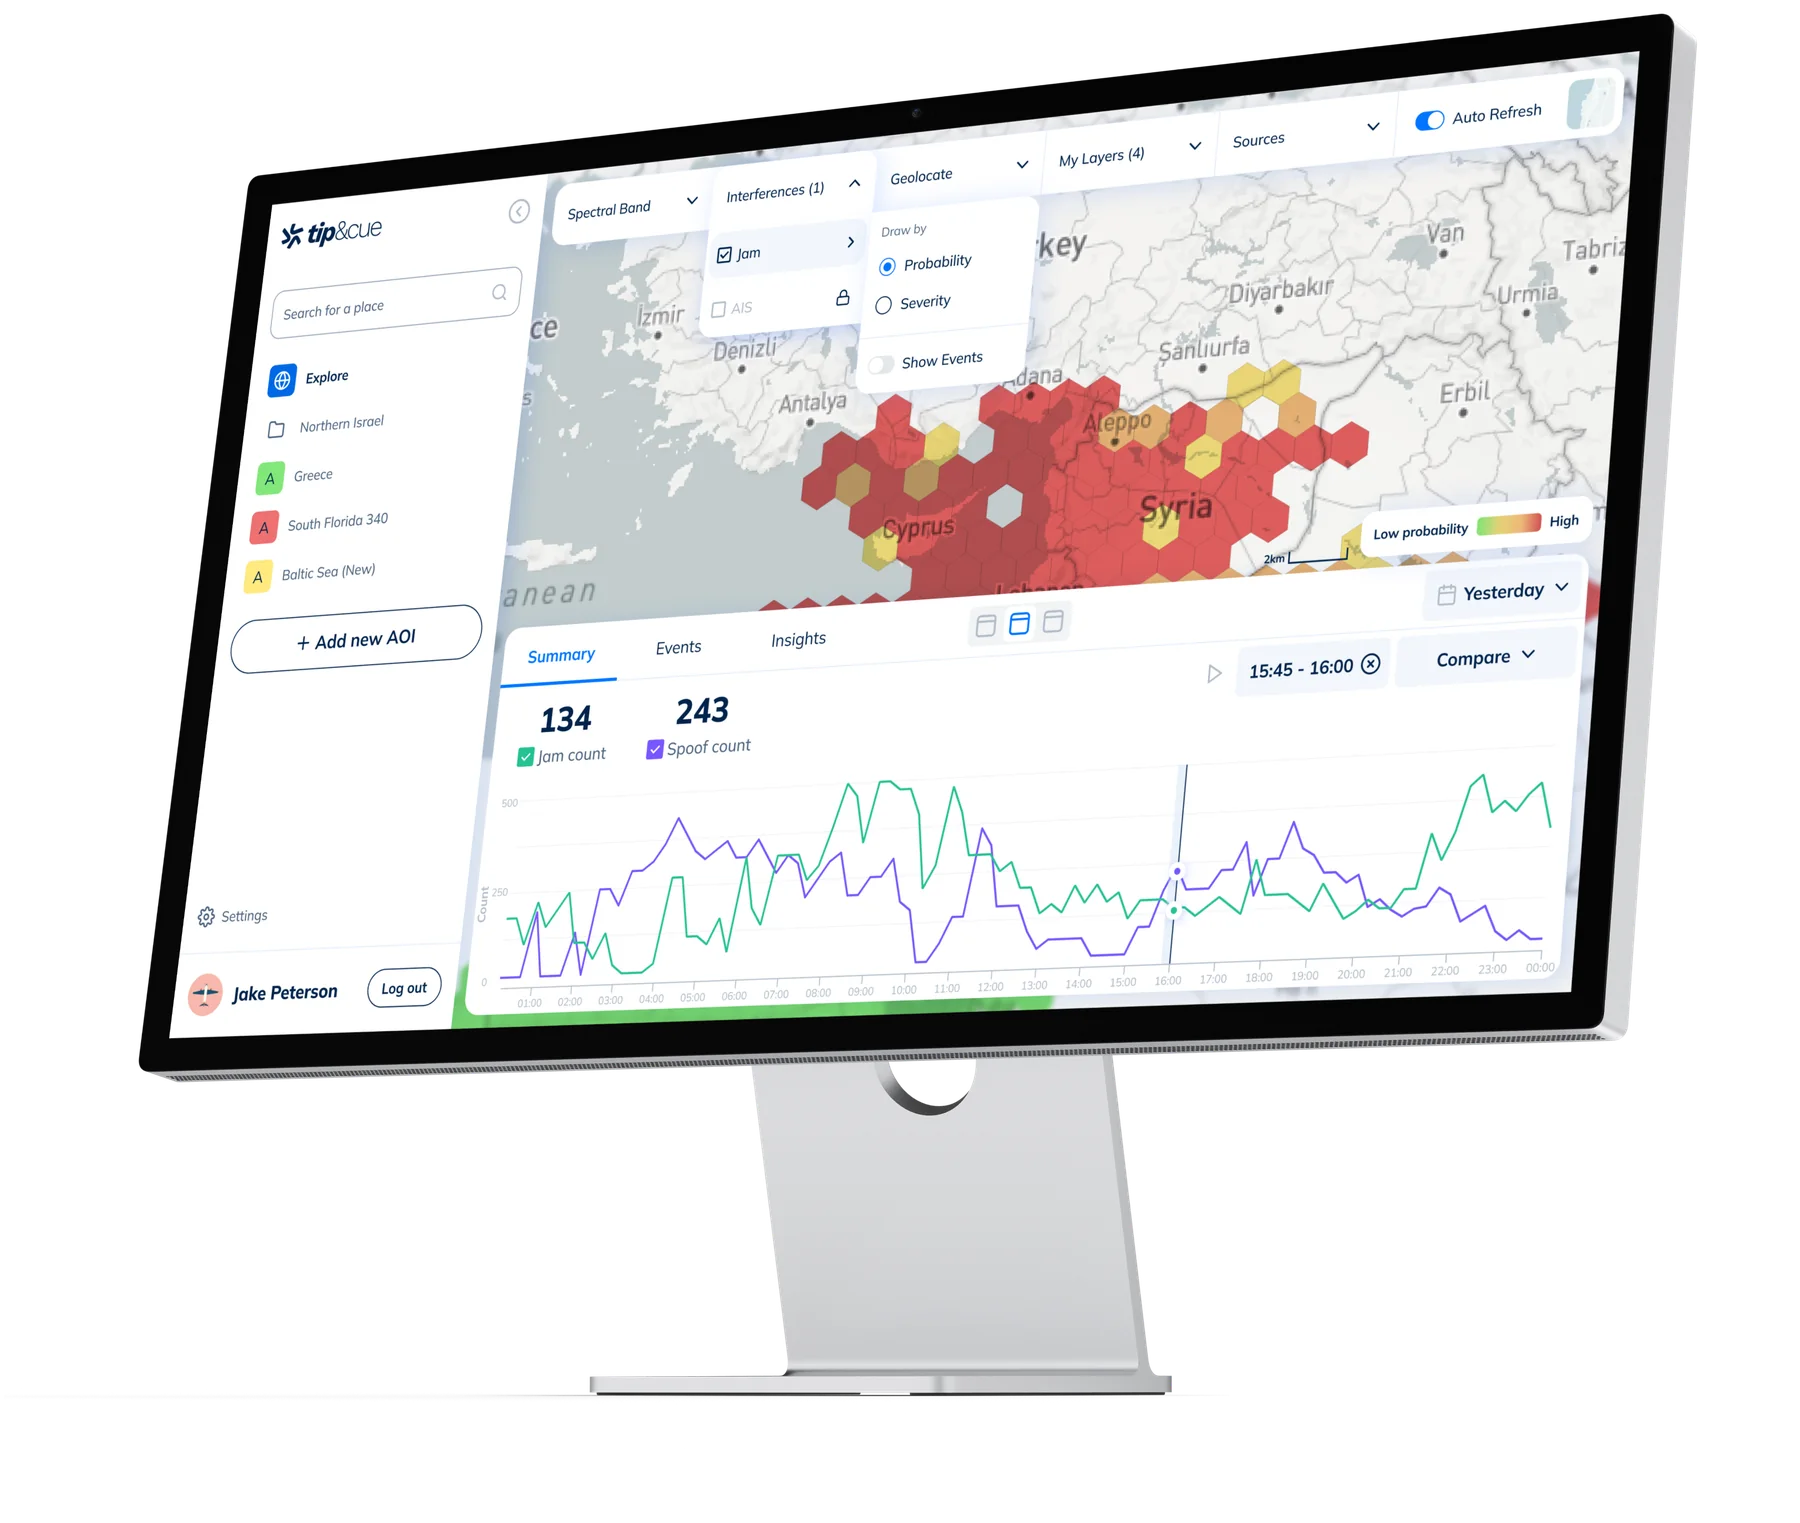
Tip&Cue Develops Signal Weather, a GPS Interference Monitor system
As a Product Designer at Create Studio, I was responsible for refining and redesigning the Signal Weather system, enhancing its functionality after the proof of concept (POC) stage.
Team
Avner & Gabriel Bendheim
Co-founders


Moshe Thishinsky
Product designer

Webiya
Developers


02 / Get Started
The first step: setting product goals and exploring the domain
Accommodating User Types
Ensuring the system supports various user types, a critical factor in the MVP process.
Creating a Clear Hierarchy
Establishing a flexible hierarchy between system components.
Enhancing User Experience
Improving user experience by understanding user needs and following market conventions.
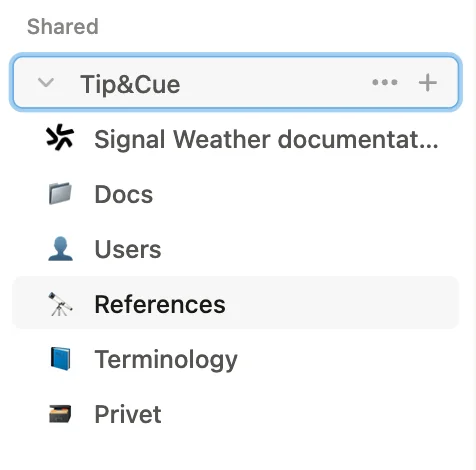
Since I haven’t earned my pilot’s license yet, I had no prior knowledge of aviation
To bridge the gap, I took an intensive crash course—researching online, reviewing client docs, and watching technical videos. I organized everything in Notion, creating guides, a glossary, and key insights. This groundwork helped me understand challenges, engage with stakeholders, and design effectively.
03 / Market research
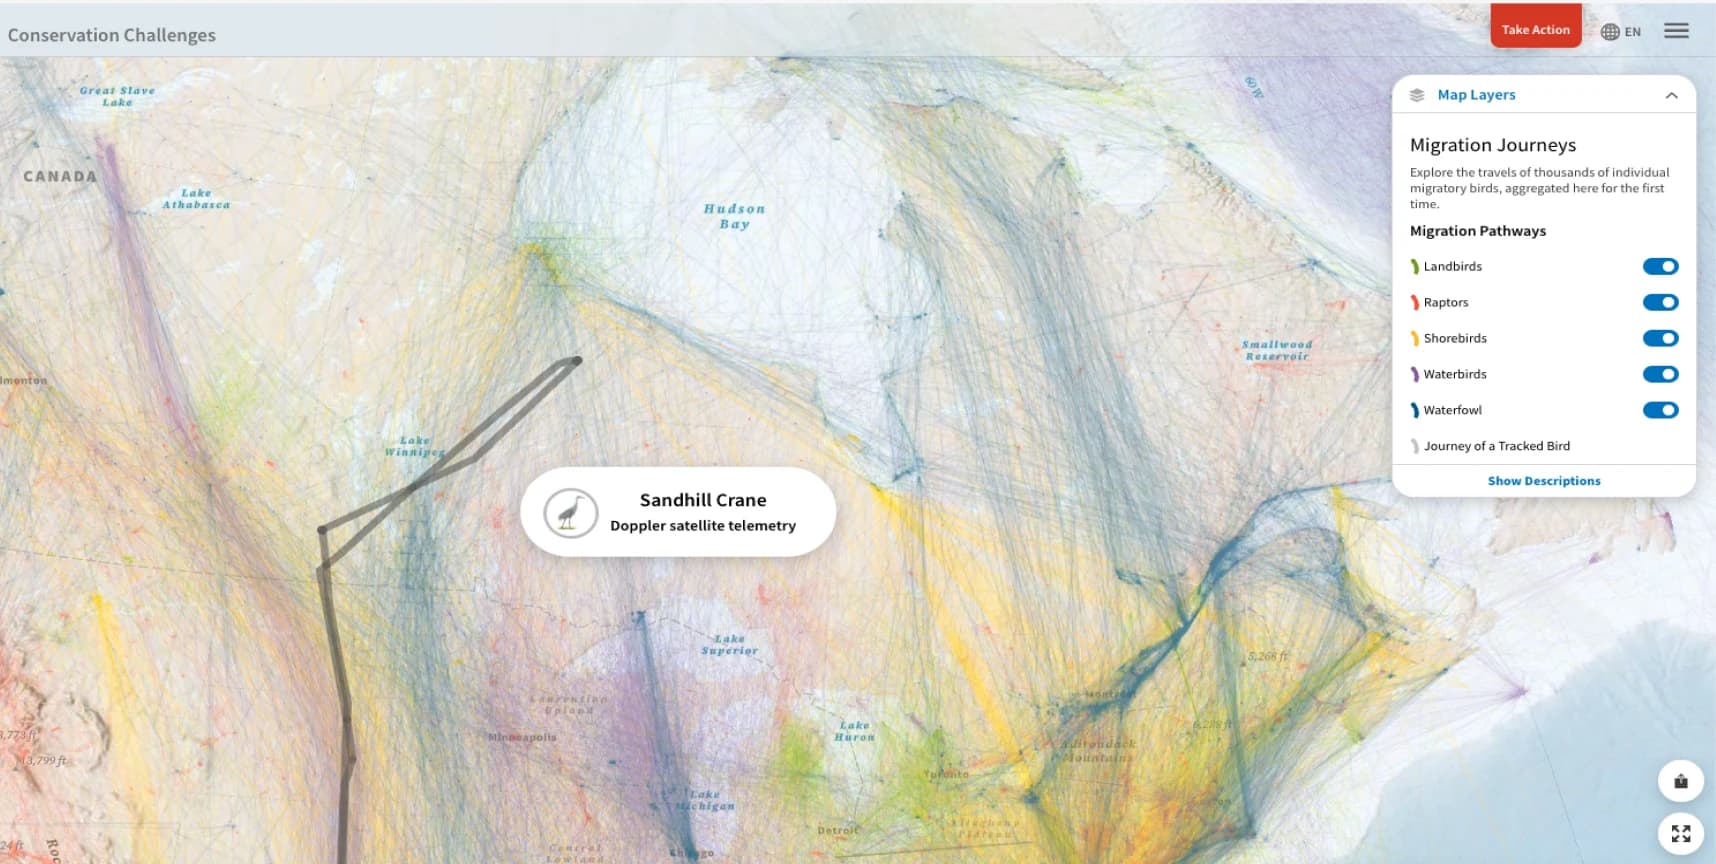
Using Bird Migration as a UX Reference for GPS Spoofing in Aircraft
I analyzed the existing system developed during the POC, gaining hands-on experience with its functionality. This phase included detailed discussions with the founders to uncover past decisions and ensure alignment with the system’s evolving needs.
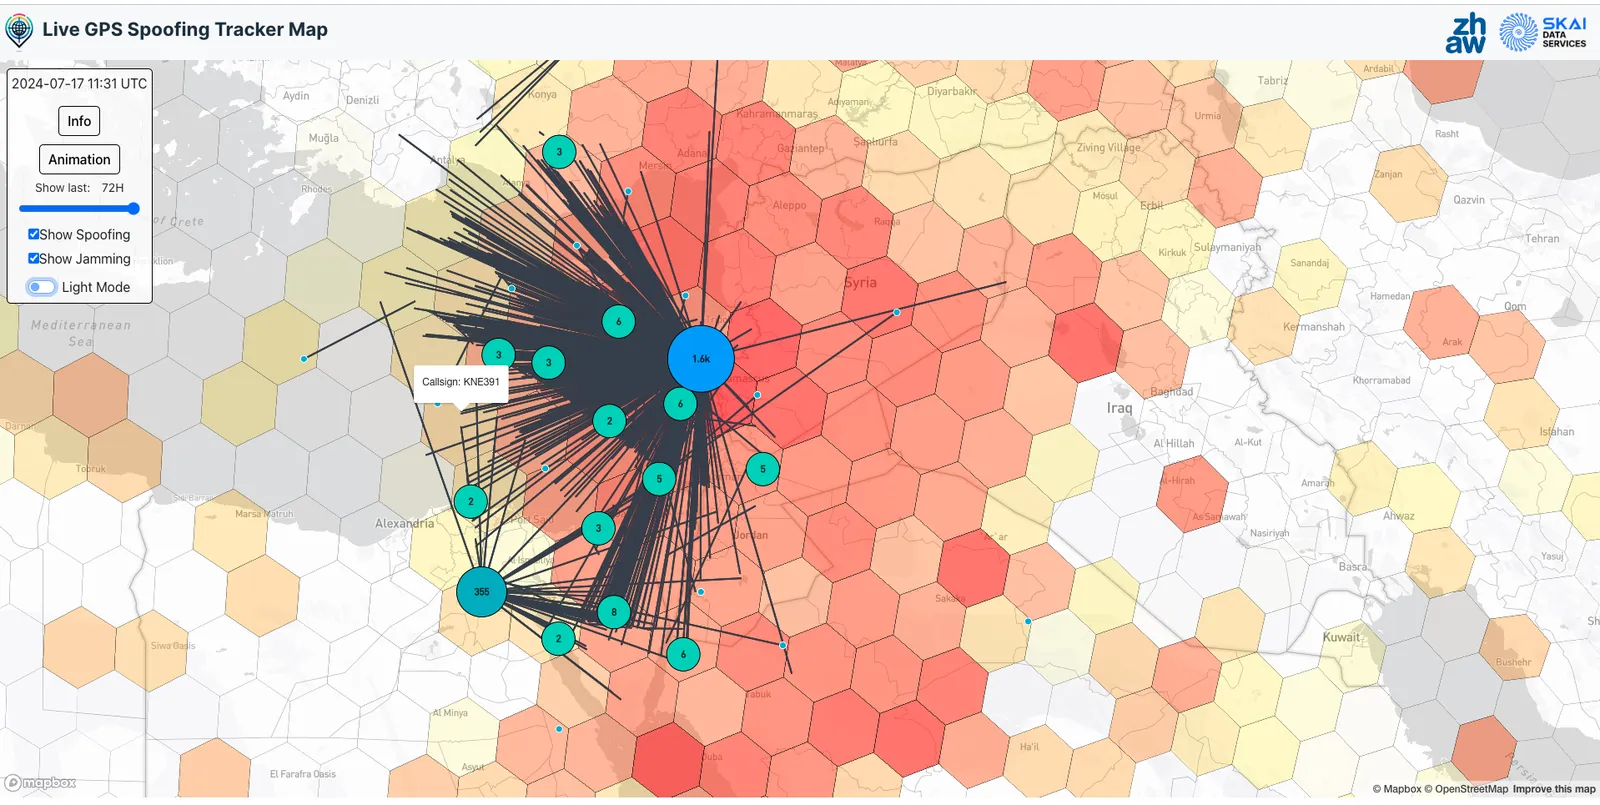
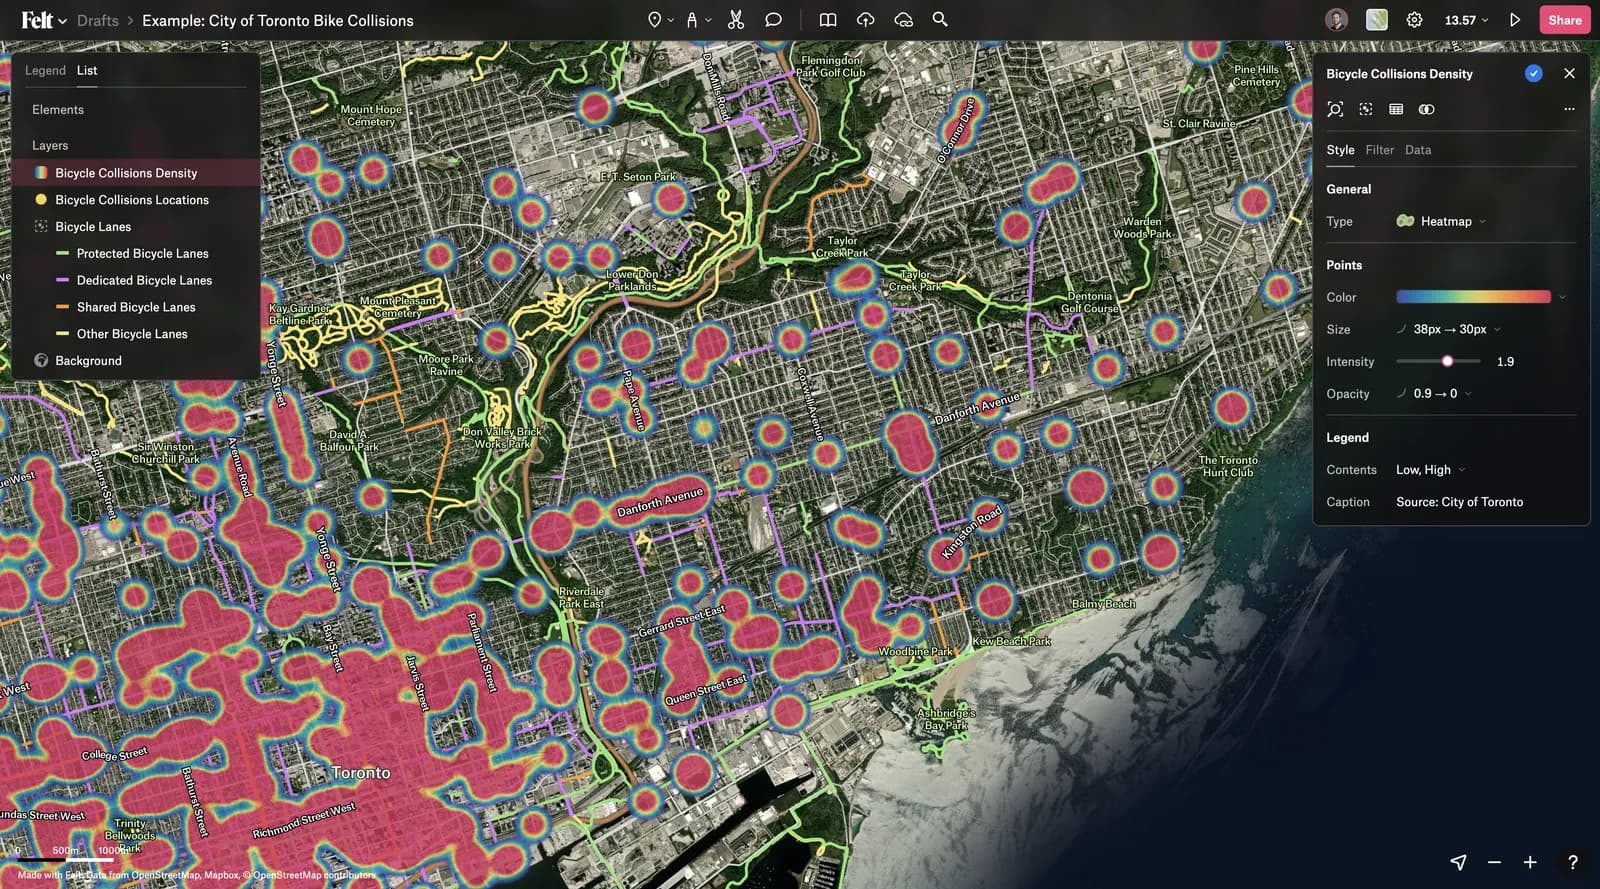
What systems were researched?
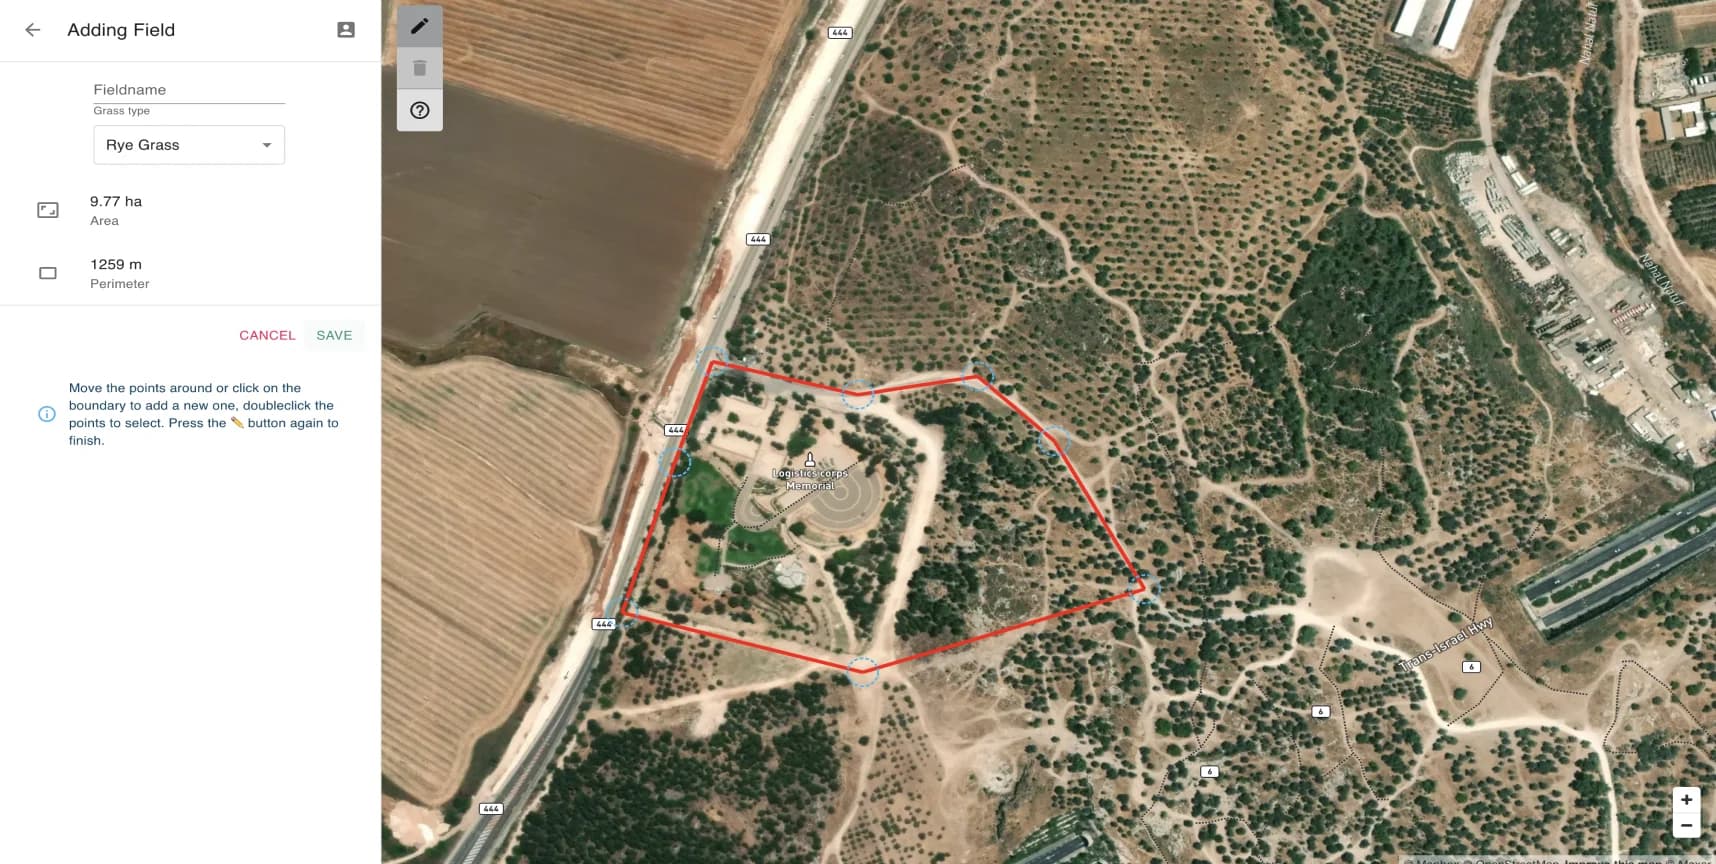
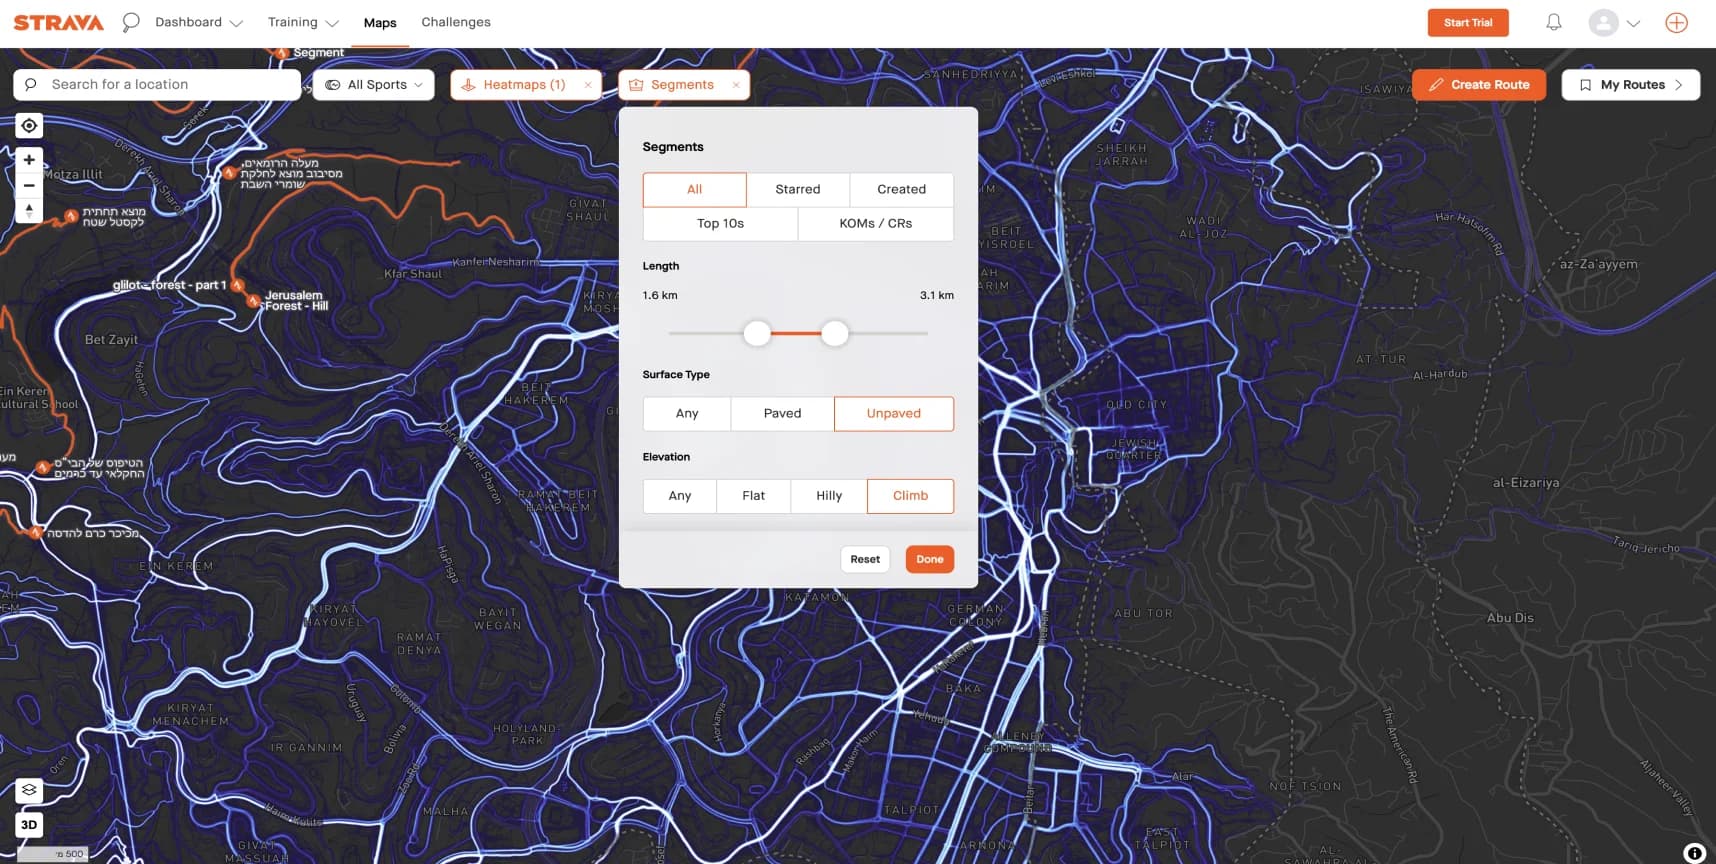
A wide range of platforms was examined, including direct competitors focused on GPS interference, weather websites, analytics tools, map infographic platforms, AgTech solutions, and even bird migration tracking sites.
Which challenges were identified for research?
- How can users effectively manage multiple map layers?
- What is the best way to alert users when immediate action is required?
- What are the design conventions for interfaces that combine timeline graphs and maps for data analysis?
04 / User Interviews
From Cockpits to Control Rooms: Insights from Diverse Users
The system is designed for diverse user groups, each with unique needs based on their persona. I conducted interviews with representative users from each group, analyzing and summarizing the findings to inform and refine the system’s design.
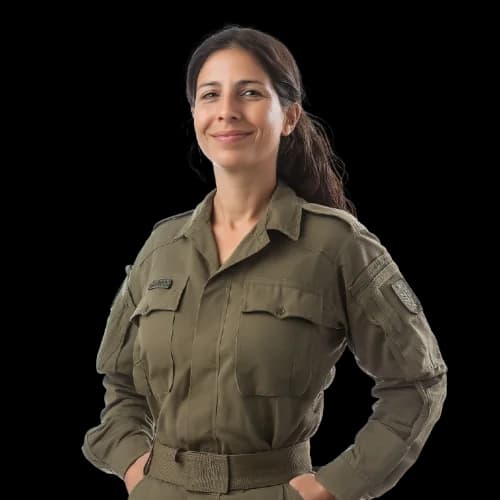
“I start my morning by monitoring 3-4 high-level Areas of Interest. When I notice interference events or disruptions worth investigating, I dive into the data to explore potential explanations.”
— M, Officer, Intelligence Corps, IDF
What I learned from this interview:
- The AOI is the most critical factor.
- Users need the ability to explore data progressively in greater depth.
- The current status of the AOI should always be displayed.

“Air traffic controllers don’t have time to analyze data. They need to know at a glance whether it’s safe to land a plane using GPS or if alternative protocols are required.”
— Y, Director, Airports Authority
What I learned from this interview:
- Air traffic controllers face information overload and require a “traffic light” system to stay updated on GPS status.
- To derive meaningful insights, they must be able to define location, radius, and altitude.
- Policy planners need interference statistics based on specific locations.
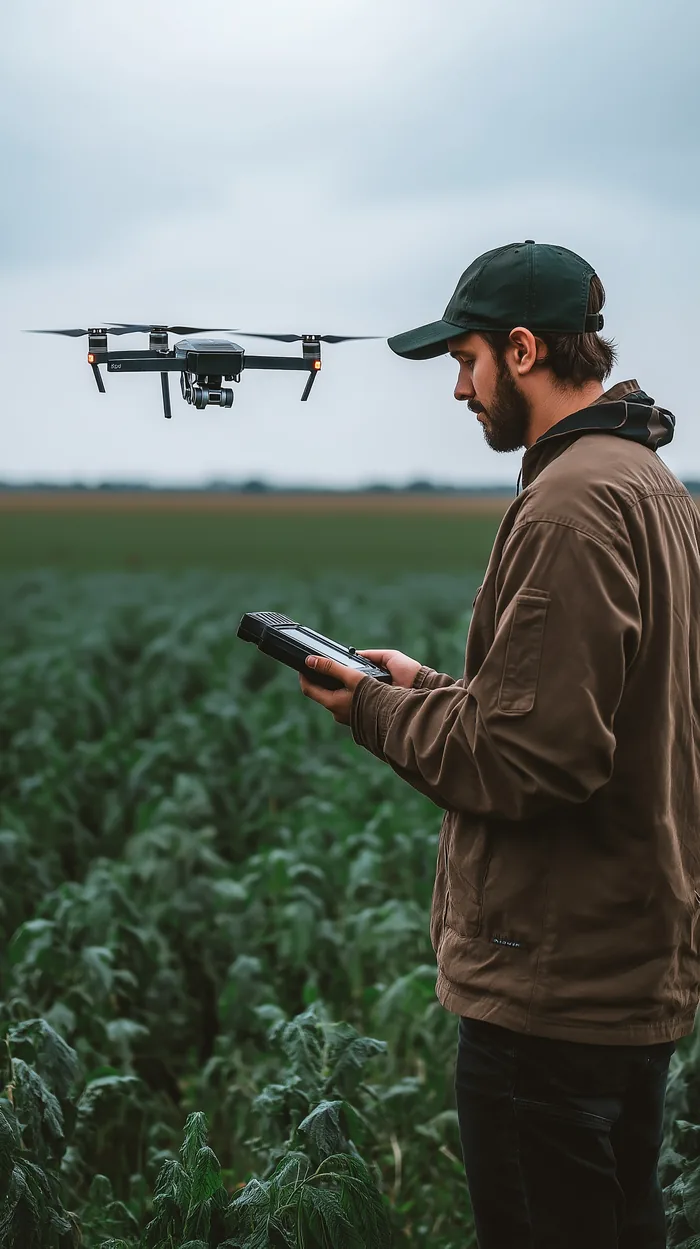
“My users need to understand disruption patterns at the square-kilometer level. Additionally, they require alerts when there are status changes in their Areas of Interest.”
— A, Platform Manager, Drone Fleet Management
What I learned from this interview:
- Drone operators should be able to define a specific location down to the address level.
- Drone operators should receive interference statistics for the selected location.
- Drone operators should receive real-time notifications about changes in GPS reception status.
05 / Wireframes
Rethinking Interface Hierarchies: Lessons from an Israeli Author
I once read an interview with Israeli author Meir Shalev, where he described his writing process. He writes separate episodes and then scatters the papers across the floor, using a stick to arrange the plot into a correct literary order.
Inspired by his description, I organized the components I knew needed to be on paper, then deconstructed and reconstructed them in various combinations. This approach allowed me to challenge the structures I had seen and explore new solutions.
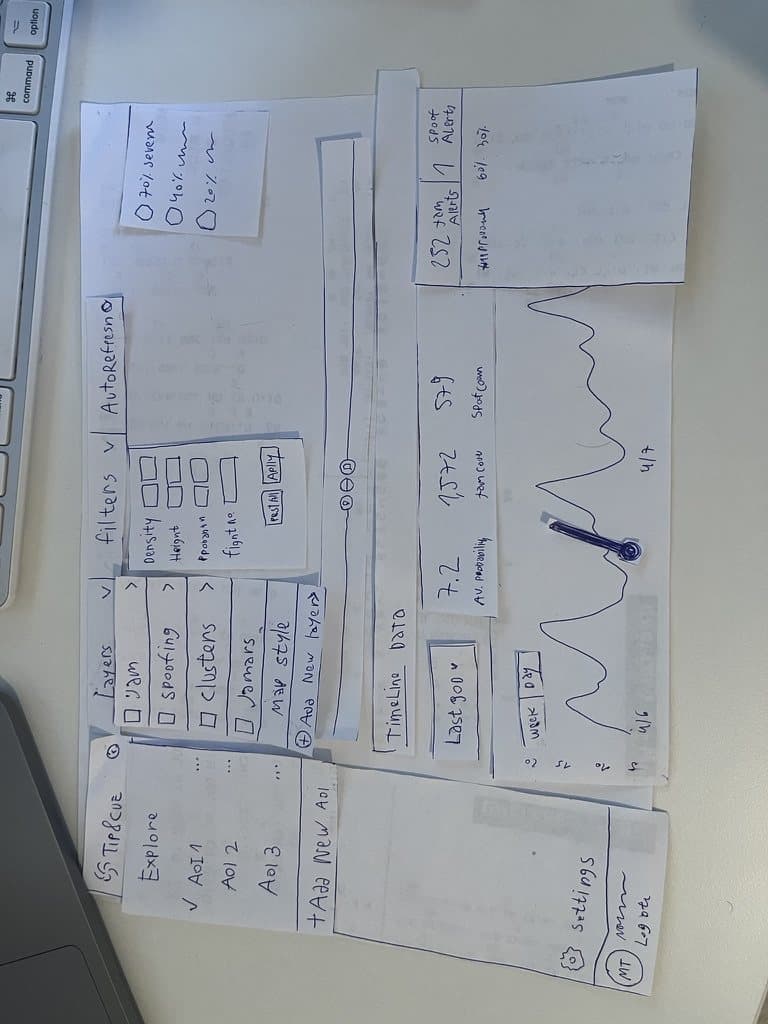
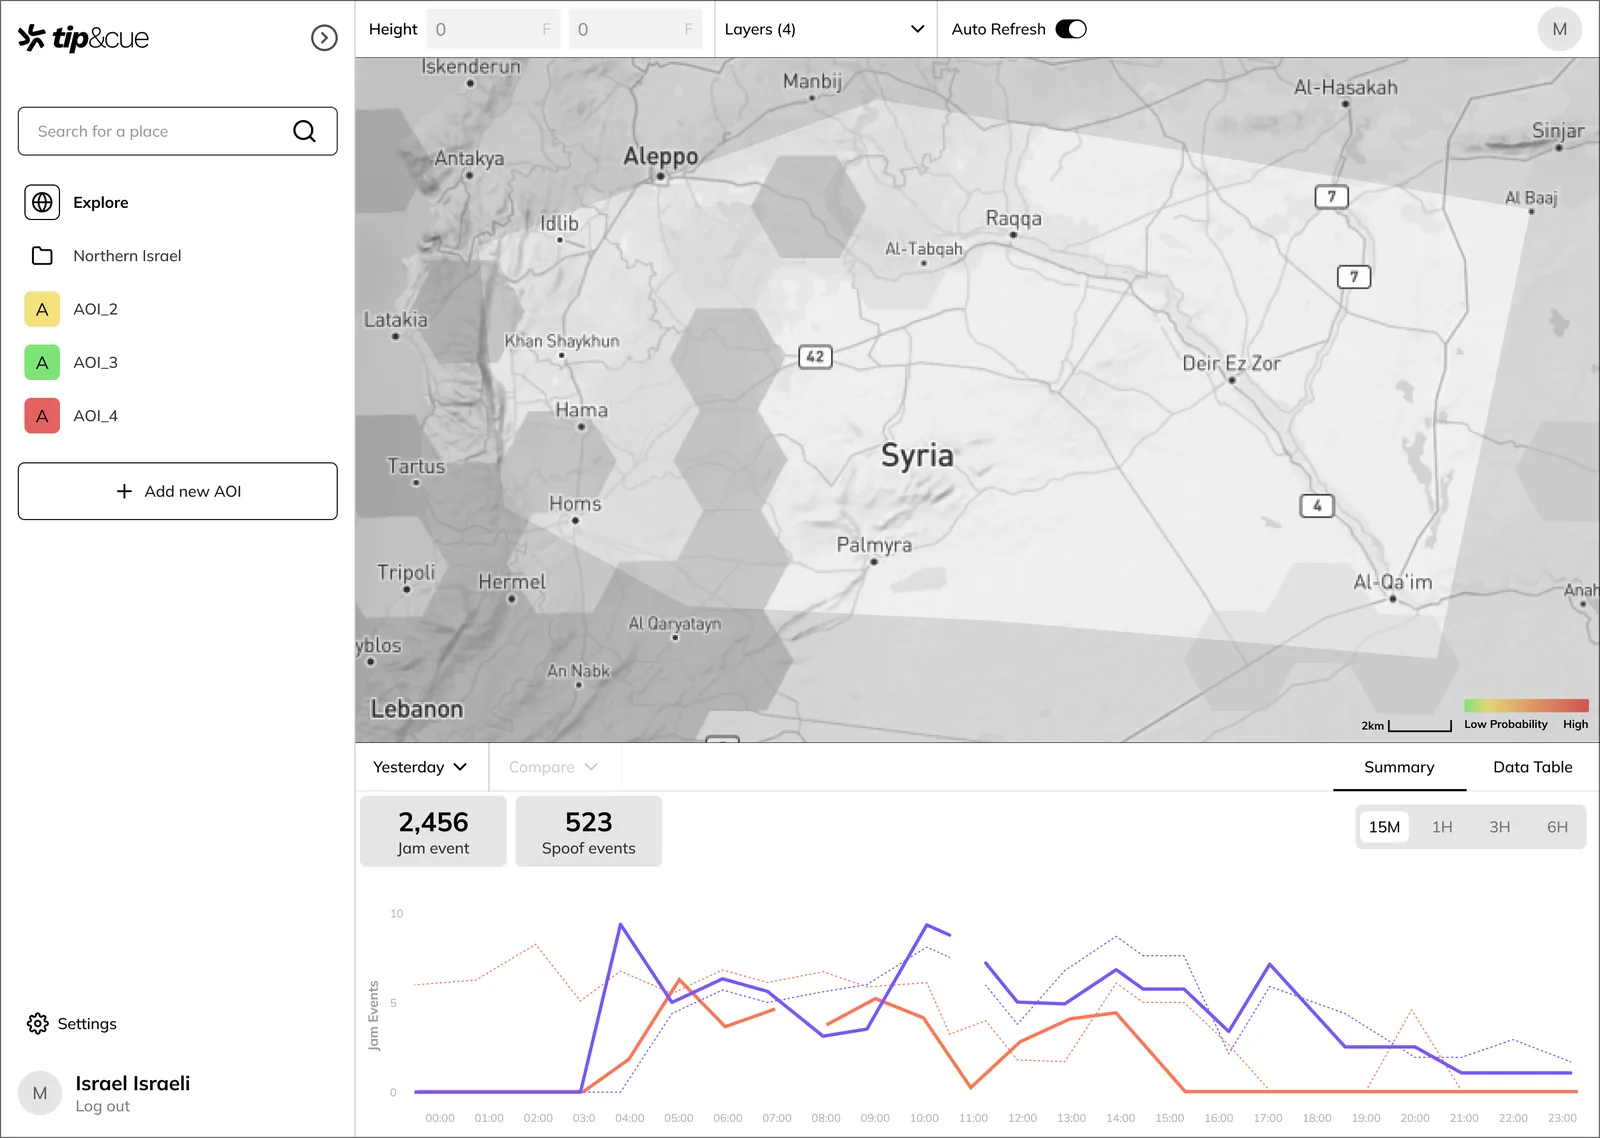
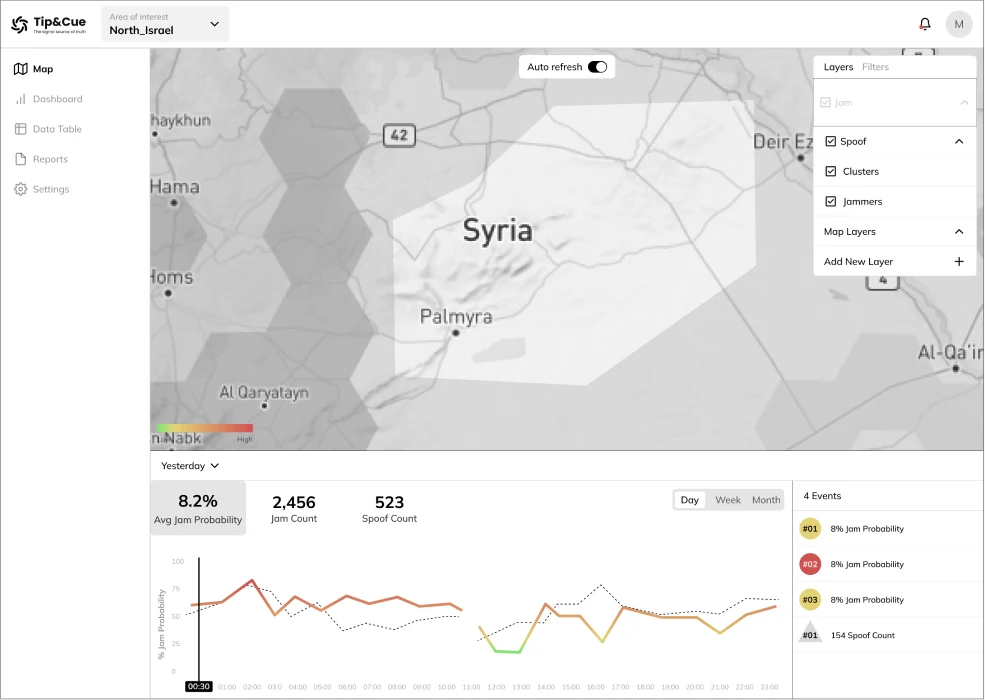
After completing this stage and integrating insights from the market research and user interviews, I developed two wireframe concepts. Each concept offered a distinct approach to system usage, differing in hierarchy, navigation, and content presentation.
06 / UI design
A hard sentence for a designer to say: “My design is generic”
When I approached the design phase, I understood that the primary goal was to provide aesthetic support to the functionality. The system is dense and complex, and users interact with it alongside other intricate systems in high-information environments.
For this reason, I opted for a flat and clean design concept, with blue as the main color due to its versatility and neutrality. While the design doesn’t aim to be particularly distinctive or attention-grabbing, every screen was crafted with pixel-perfect precision and great care, ensuring a visually pleasant, clear, and user-friendly experience.
Key feature
01
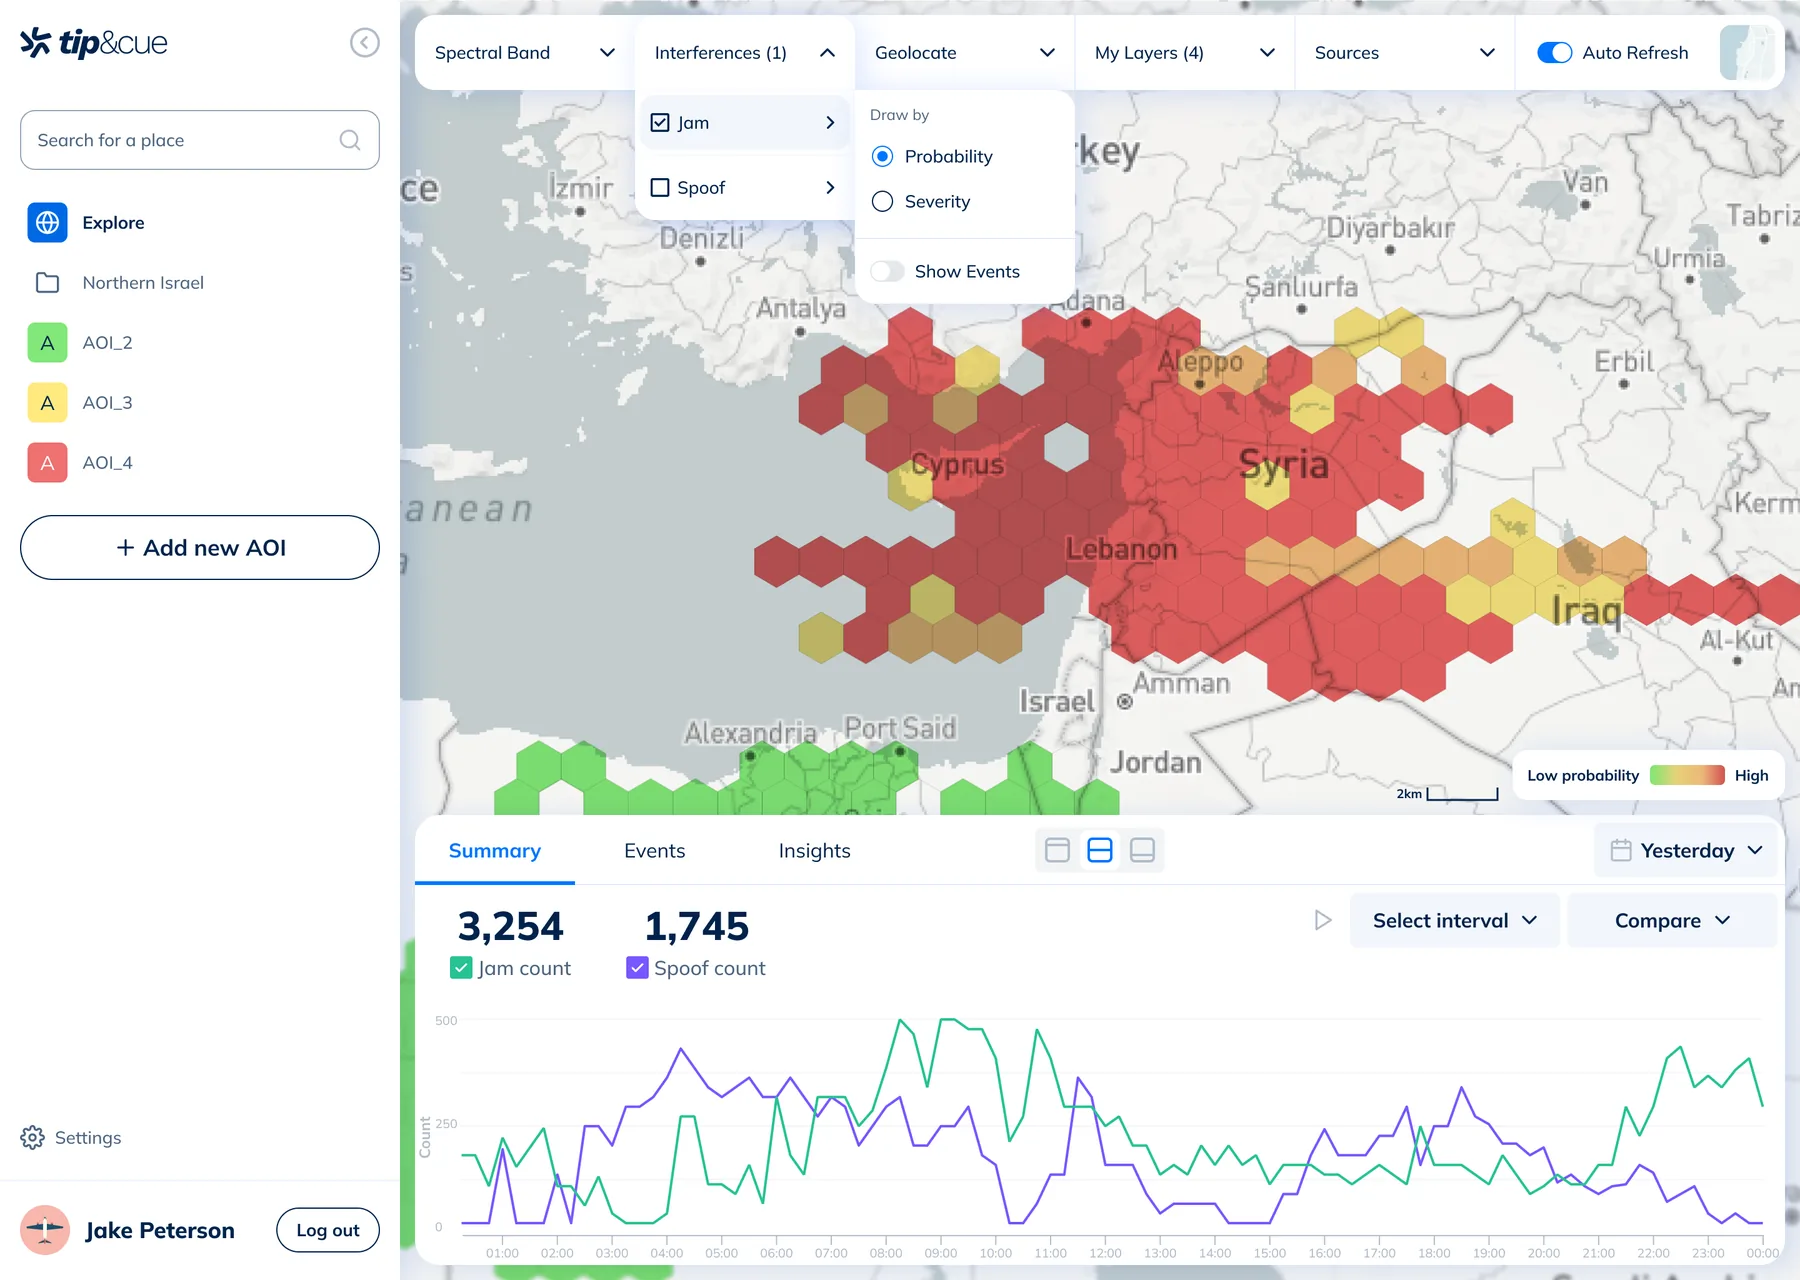
Exploring the Map
The top bar allows managing the map configuration: selecting which layers to display, choosing the map type, uploading custom maps, and more.
Key feature
02
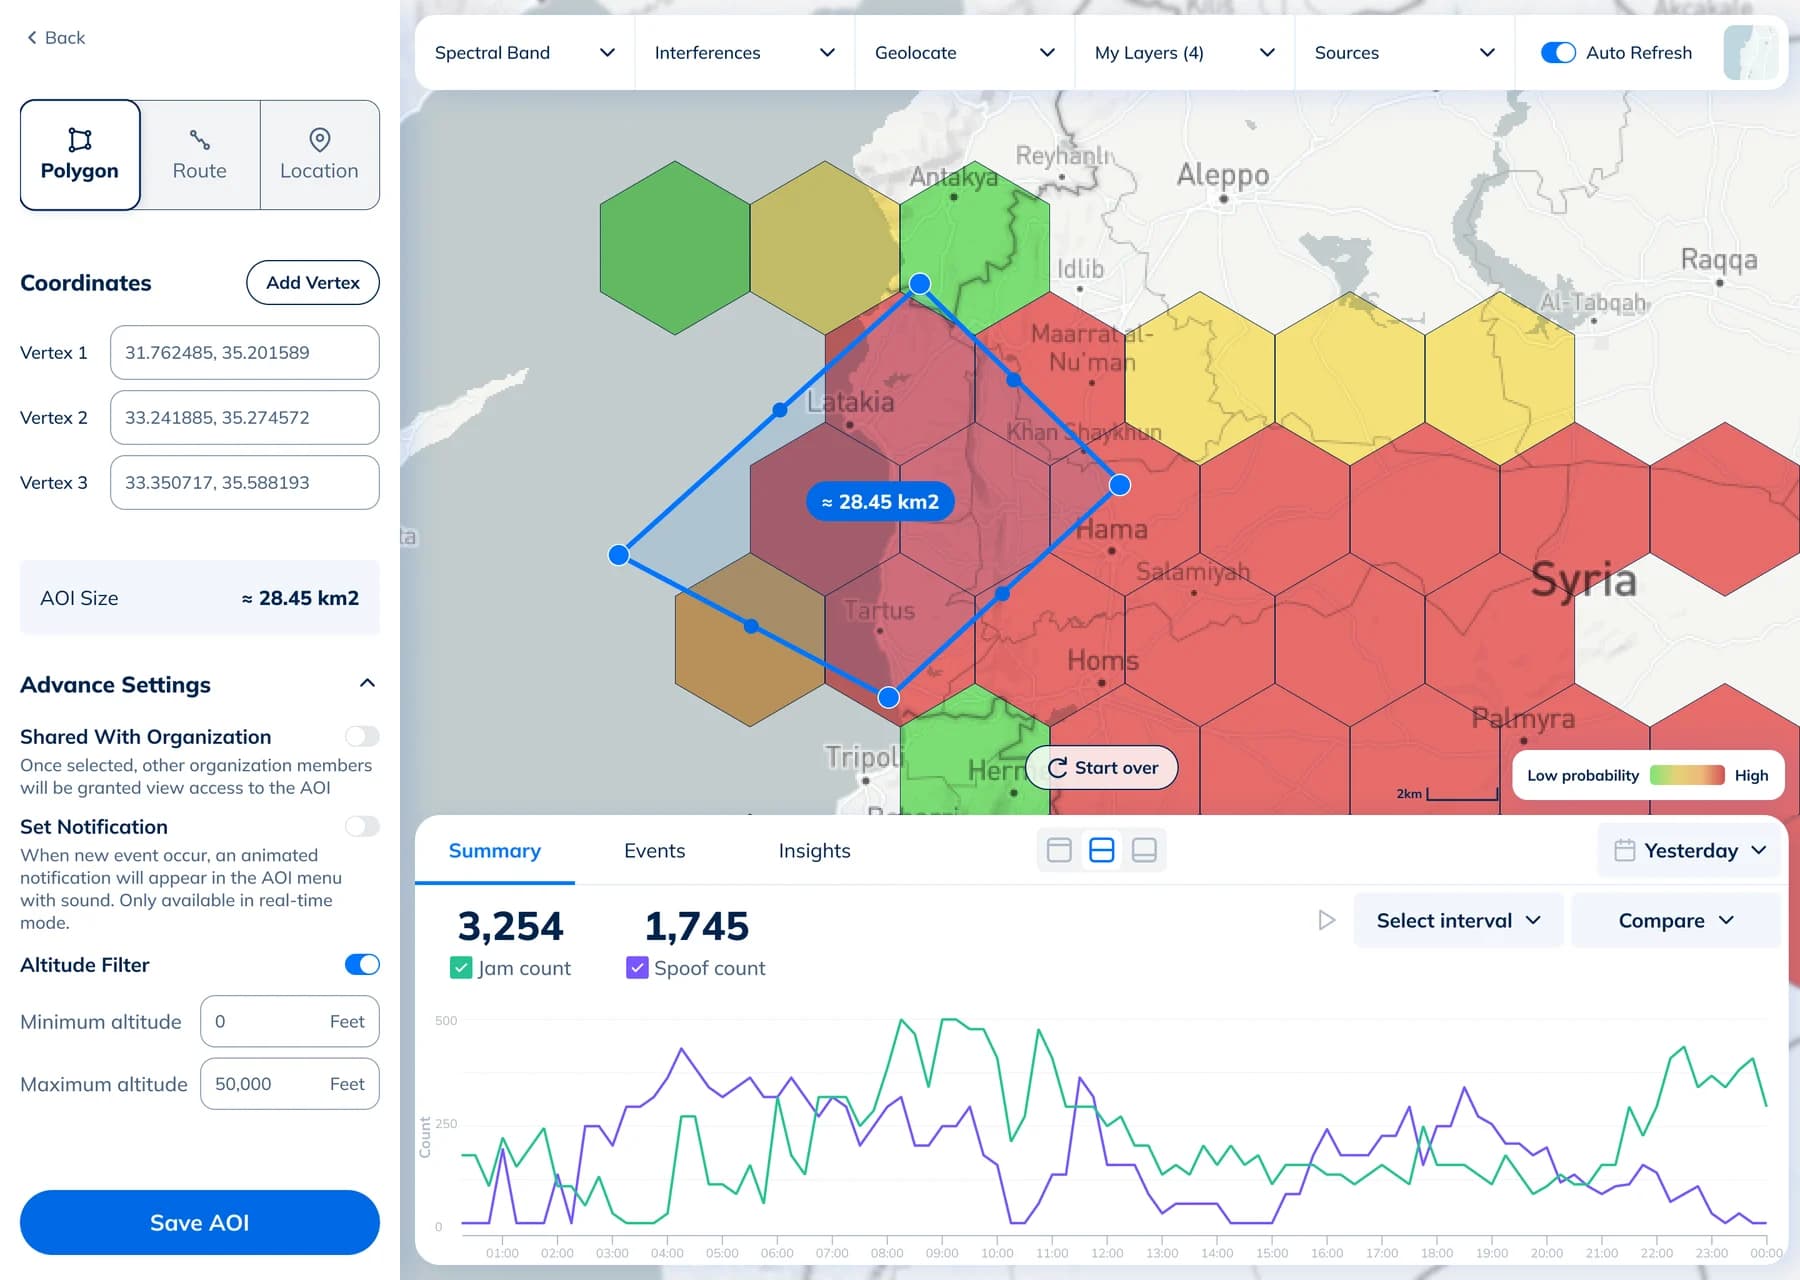
Creating and Managing Areas of Interest
A key feature of the system is the ability to create Areas of Interest (AOIs) that allow users to monitor locations relevant to them. Users can create AOIs as lines, shapes, or points, marking them directly on the map or by entering coordinates.
Key feature
03
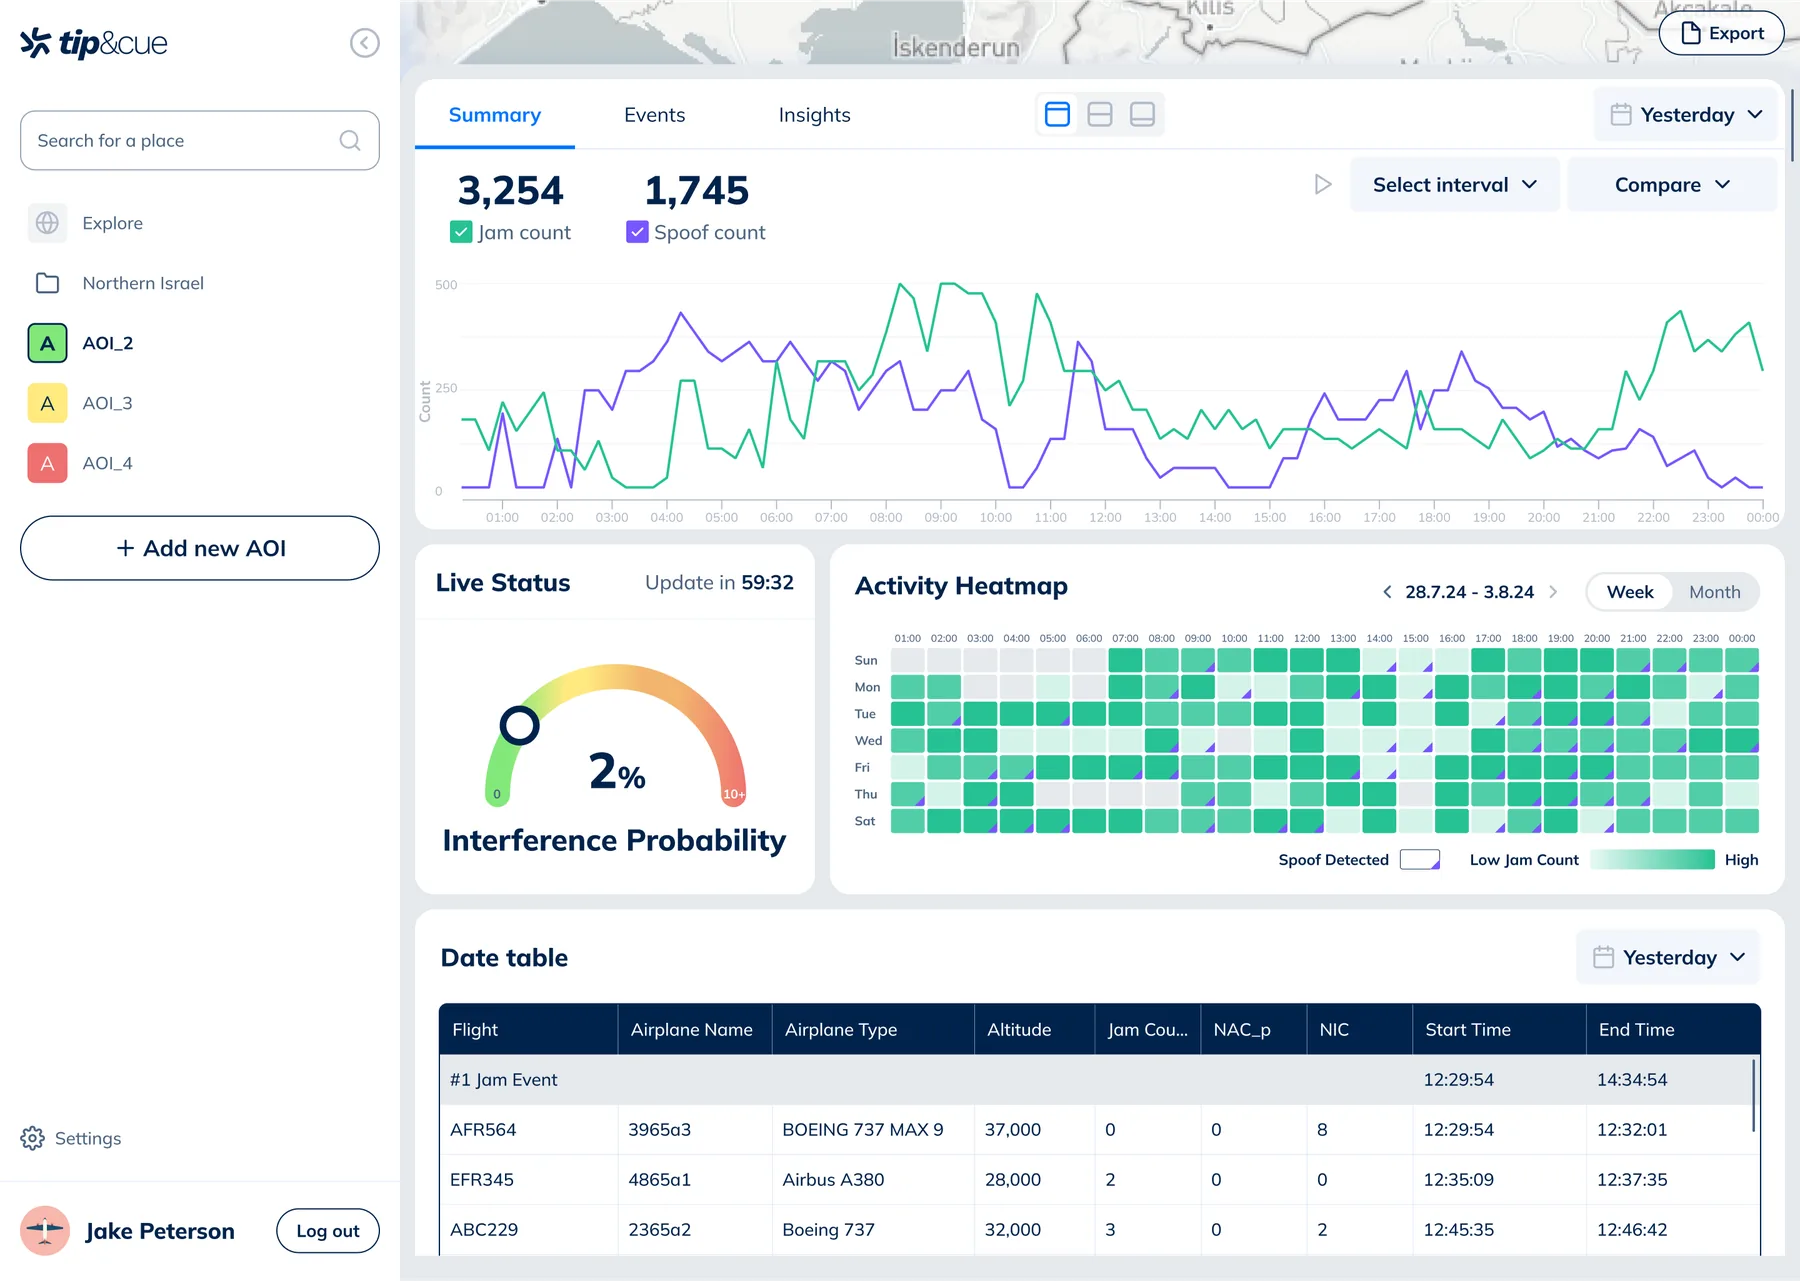
Data Research
Users require different levels of information, and we enable them to grasp trends while diving into details as needed. By default, the most critical graph is displayed, summarizing the number of detected disruptions throughout the day. Users can expand the data section to view trends over the month (activity heat map), real-time summaries, and a table containing all information and an event view.
More design screens that I couldn’t leave behind :)
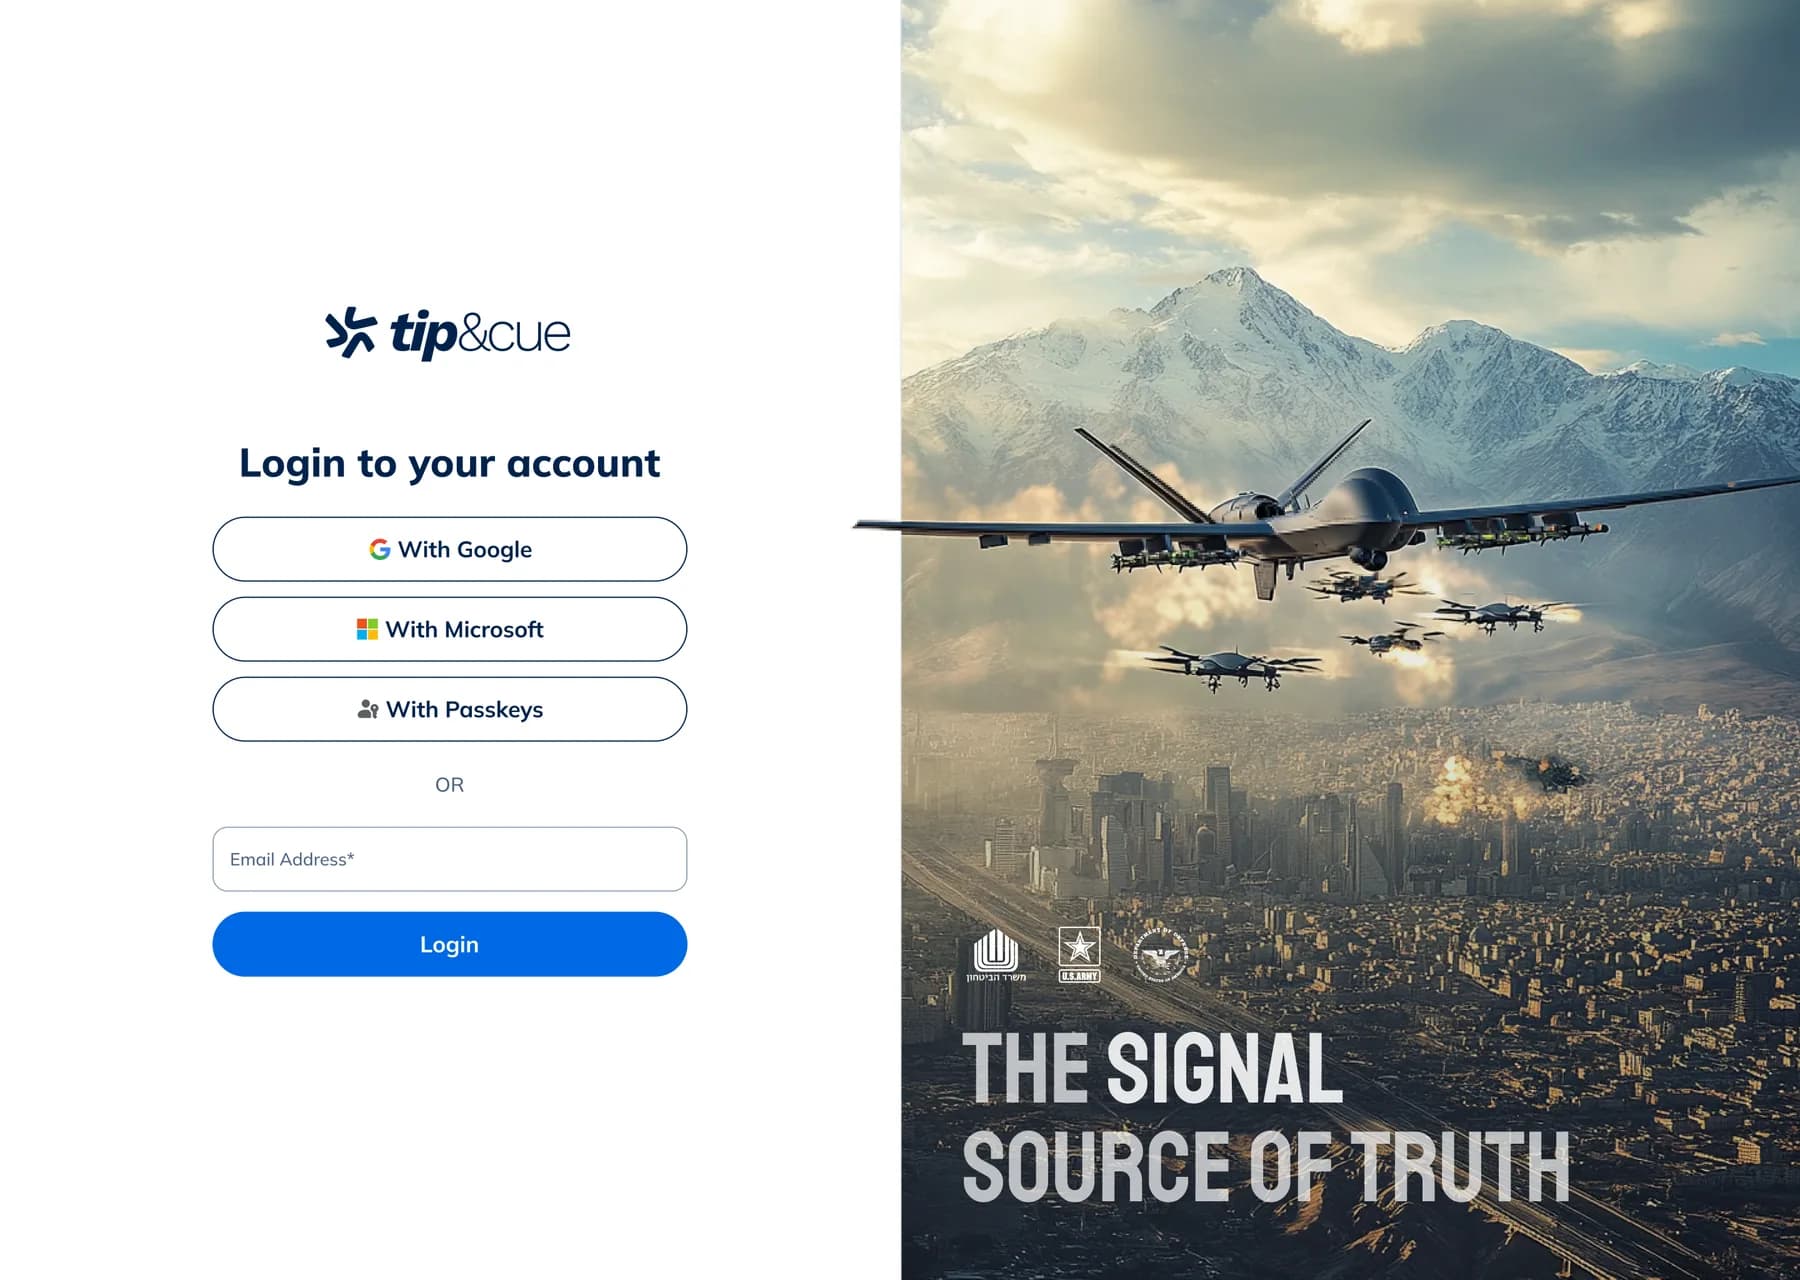
Login screen
07 / Usability testing
Side story: Usability testing to the navigation and making informed design decisions
First Iteration
The system offers two ways to display information:
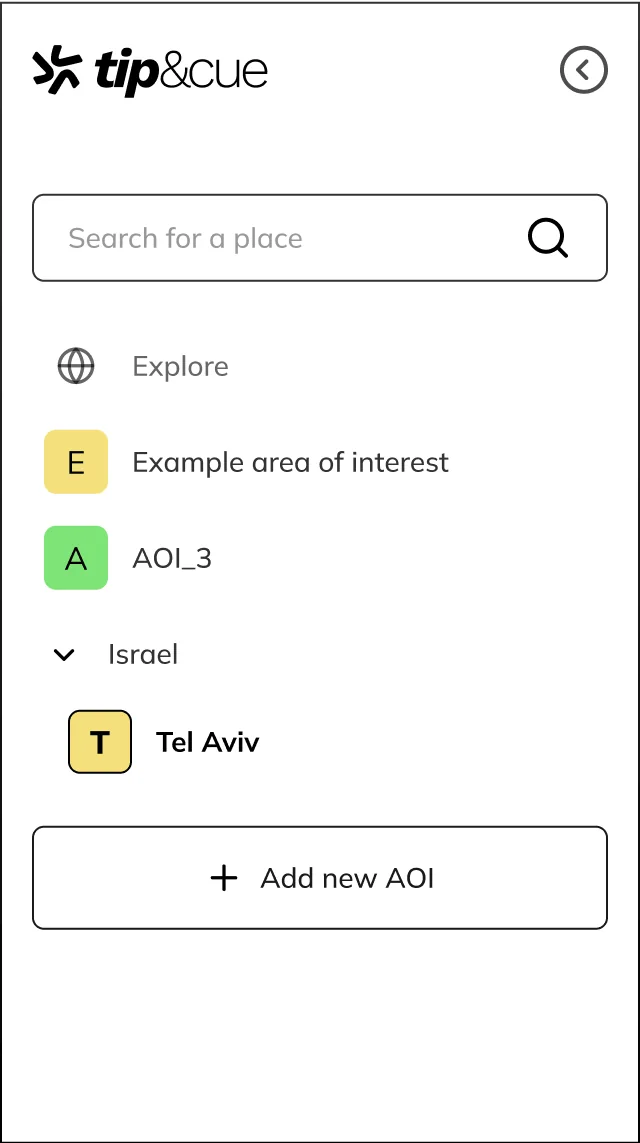
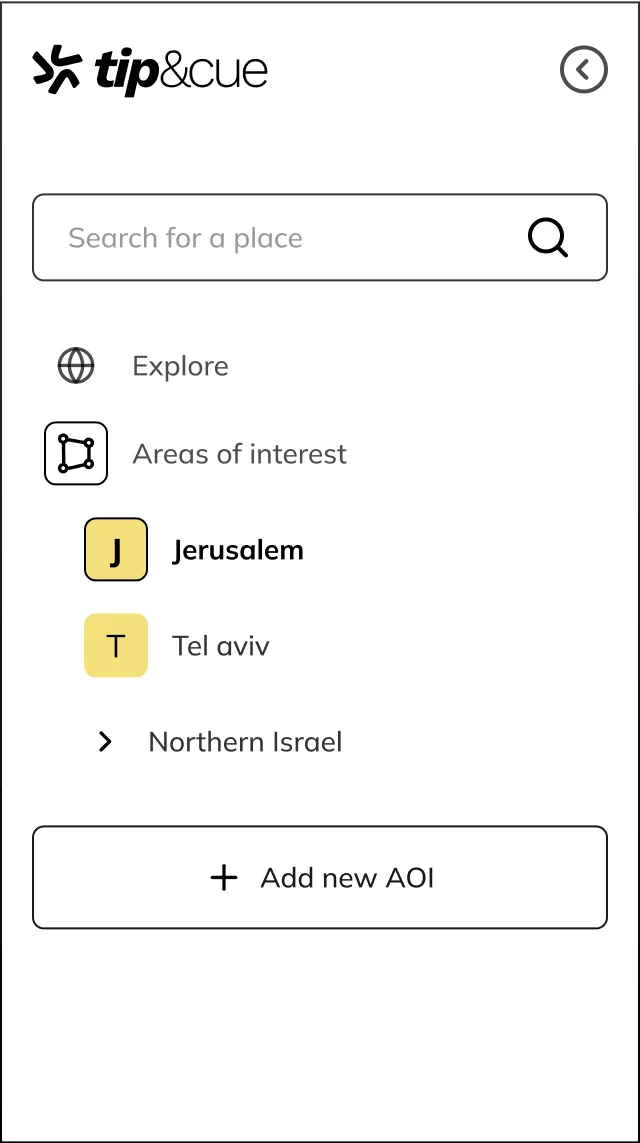
The “Explore” mode, where users can freely navigate the map, and the AOI mode, where users are focused on a defined area, and the displayed data pertains only to that specific area. In the initial design, I chose to use a flat hierarchy where the Explore mode is presented alongside Areas of Interest. (1)
The founders were not entirely happy with this solution.
In the feedback I received, they preferred a clear hierarchical division between the options: a separate Explore mode, and a separate 'Interests' mode. (2)
 1
 2
Testing and Result
To make a decision after research failed to yield results, I applied usability testing methodology: I created two working prototypes showcasing different navigation types and formed two groups, each testing one type. Each group consisted of 3 users.
Users were briefed on the system and tasked with selecting an Area of Interest and noting a relevant data point. I tested three parameters with this simple task and follow-up questions: How clear was the hierarchy on their first attempt? How long did it take to complete the task? How difficult was the task?
Although the sample size wasn’t statistically significant, in the first group (flat navigation), 3 out of 3 users successfully navigated and explained the logic. In the second group, 2 out of 3 succeeded, and the hierarchy was less clear.
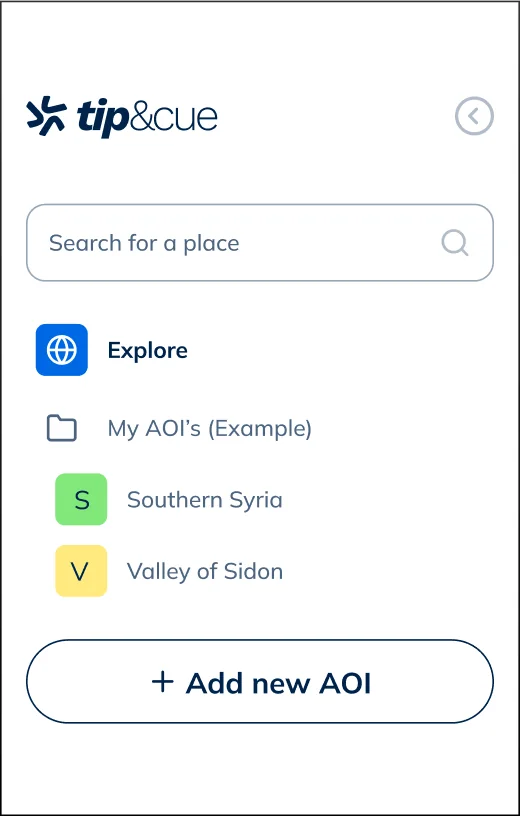
The navigation menu was redesigned based on these findings with slight adjustments to align with stakeholders’ perspectives.
Changes made:
- The folder icon was selected to reflect a more intuitive connection between AOI groups.
- The default setup will include a folder with two Areas of Interest to demonstrate the system’s organizational capability, while customization remains flexible. This allows new users to access folded data, and experienced users can customize their list without added hierarchy.
08 / Prototypes & Animations
Motion: Where the Product Comes to Life
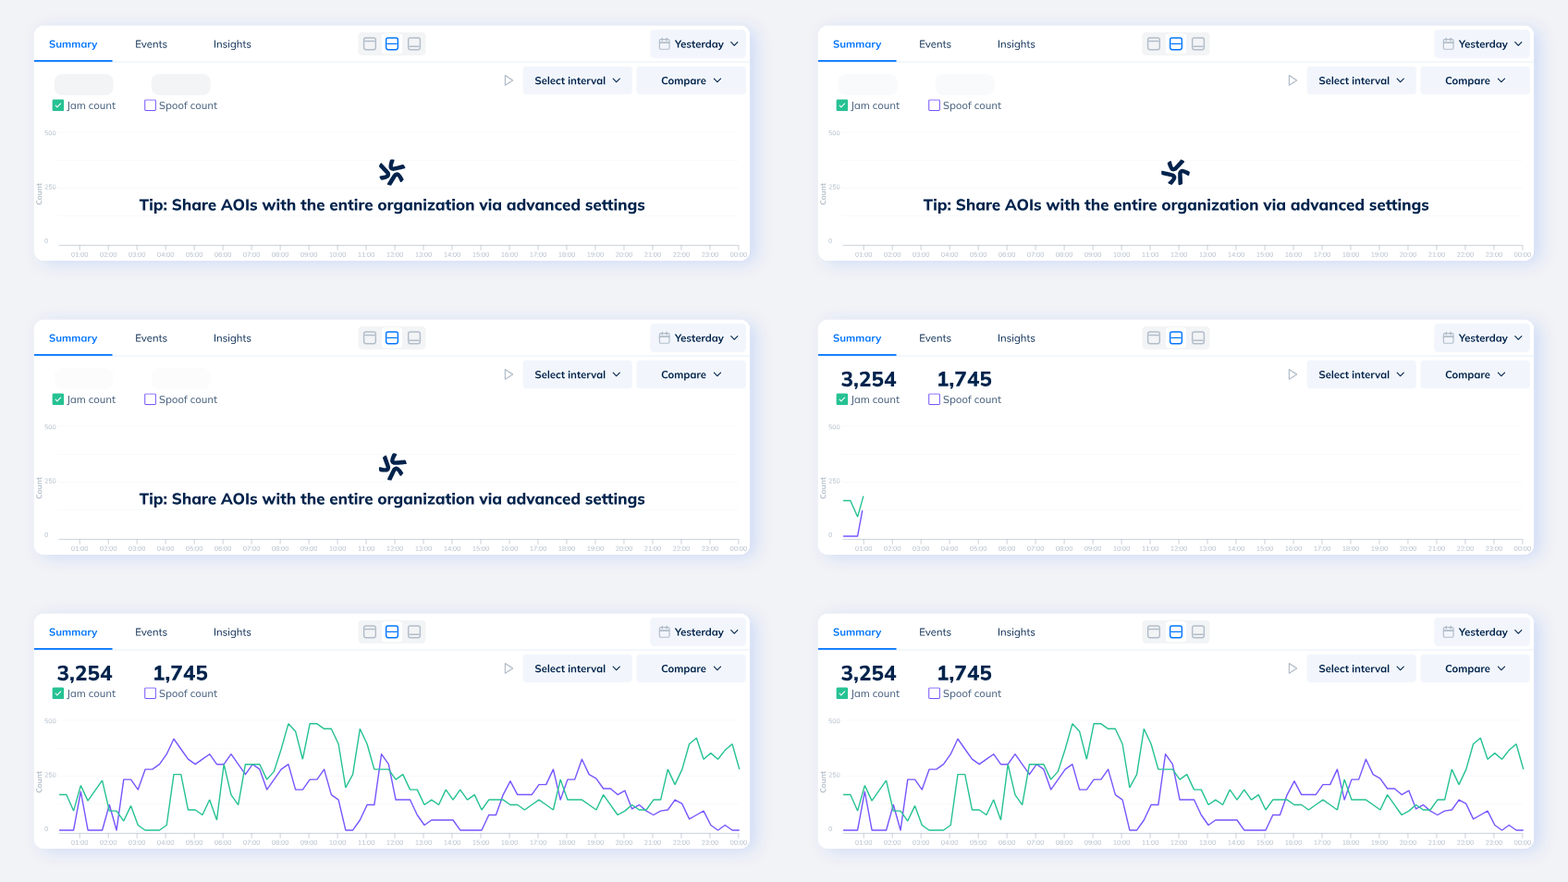
I greatly enjoy integrating animations into the interface. Beyond enhancing the user experience by making it more engaging and pleasant, animations can often help resolve usability issues.
In the data area, there was a concern that loading the data would take too long, so I created loading animations that incorporate contextual information on advanced system options.
Created using lottielab
09 / Design System
Collaboration from the very beginning with development, and working in a common language
After consulting with the developers, generic components such as date pickers were based on Material Design by Google.
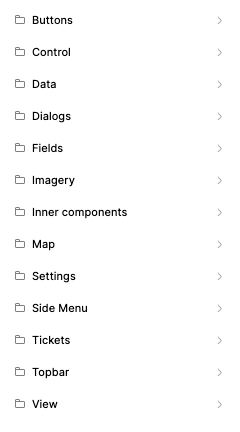
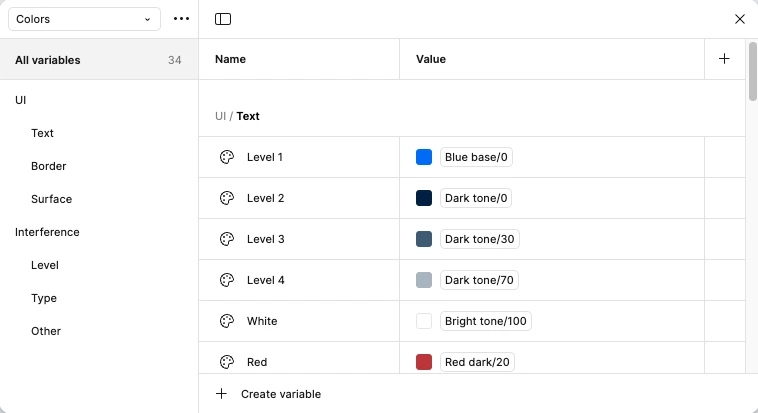
For special components, I created a design system based on the latest work methodologies, utilizing Figma’s advanced feature, Figma Variables. The system provided developers with a comprehensive overview of the components and their interactions.
10 / Summary
Results & Impact
Looking back, this project was incredibly enriching for me.
I enjoyed diving into a new field and often found myself, during runs, thinking about interface solutions.
The collaboration with different teams was productive and beneficial: deep discussions with the founders to refine problems and their solutions, coordination with the development team to align on design libraries and graphs, and working with the project manager to ensure smooth progress according to a well-defined schedule.
The final outcome of this process was a user-friendly system for a diverse range of users, receiving positive feedback from end-users and supporting the founders at a key stage to grow the startup and promote the system to potential clients.